2019 Yearly Overview

Use the arrows to see more beginner class stats.
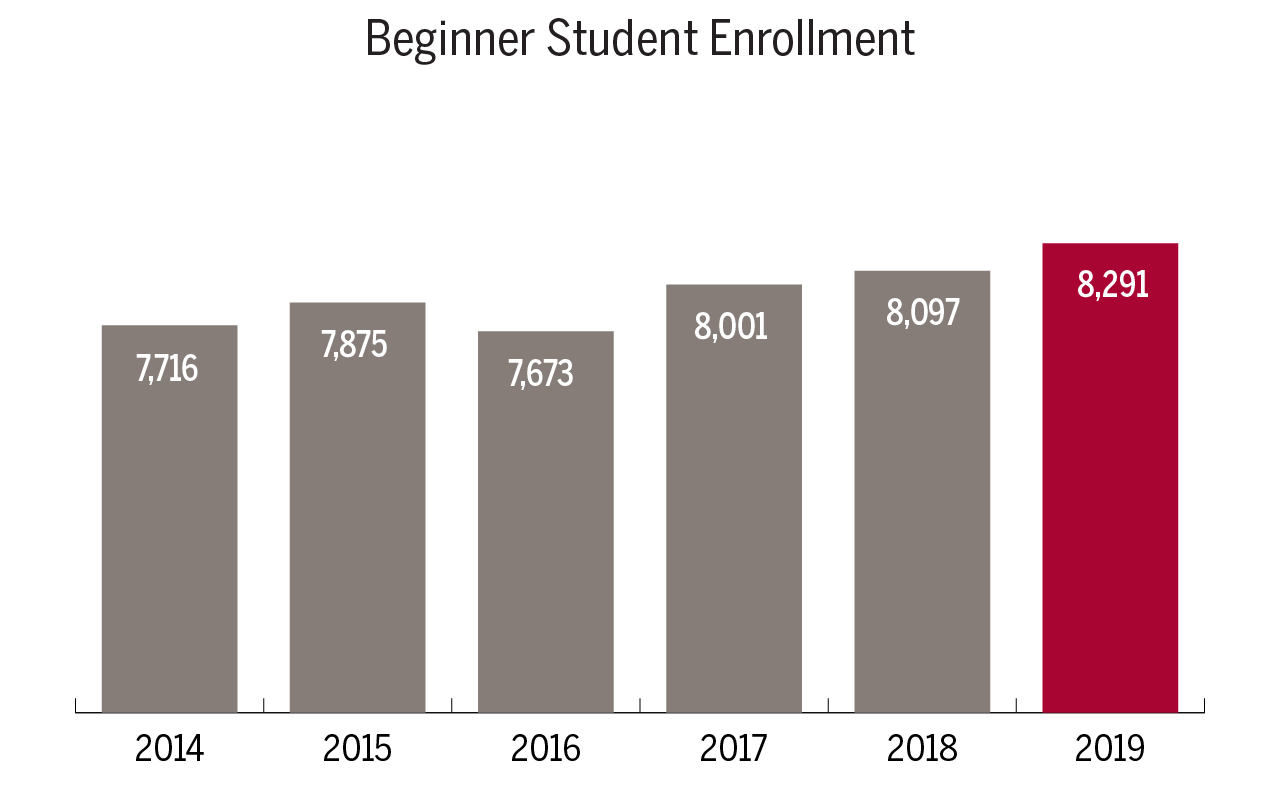
Beginner Student Enrollment graph shows 7,716 students in 2014, 7,875 students in 2015, 7,673 students in 2016, 8,001 students in 2017, 8,097 students in 2018, and 8,291 students in 2019.
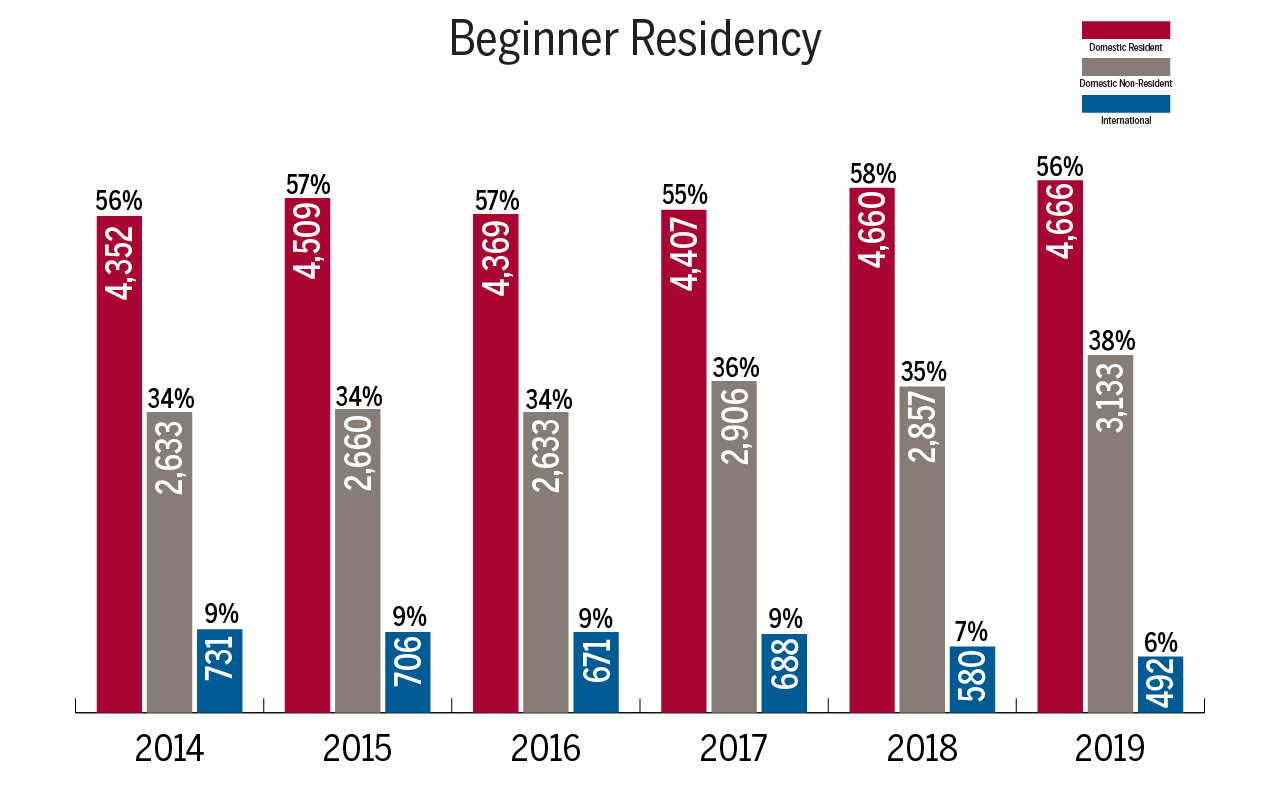
Beginner by Residency graph shows 56% or 4,352 domestic resident students, 34% or 2,633 domestic non-resident students, and 9% or 731 international students in 2014; 57% or 4,509 domestic resident students, 34% or 2,660 domestic non-resident students, and 9% or 706 international students in 2015; 57% or 4,369 domestic resident students, 34% or 2,633 domestic non-resident students, and 9% or 671 international students in 2016; 55% or 4,407 domestic resident students, 36% or 2,906 domestic non-resident students, and 9% or 688 international students in 2017; 58% or 4,660 domestic resident students, 35% or 2,857 domestic non-resident students, and 7% or 580 international students in 2018; 56% or 4,666 domestic resident students, 38% or 3,133 domestic non-resident students, and 6% or 492 international students in 2019.
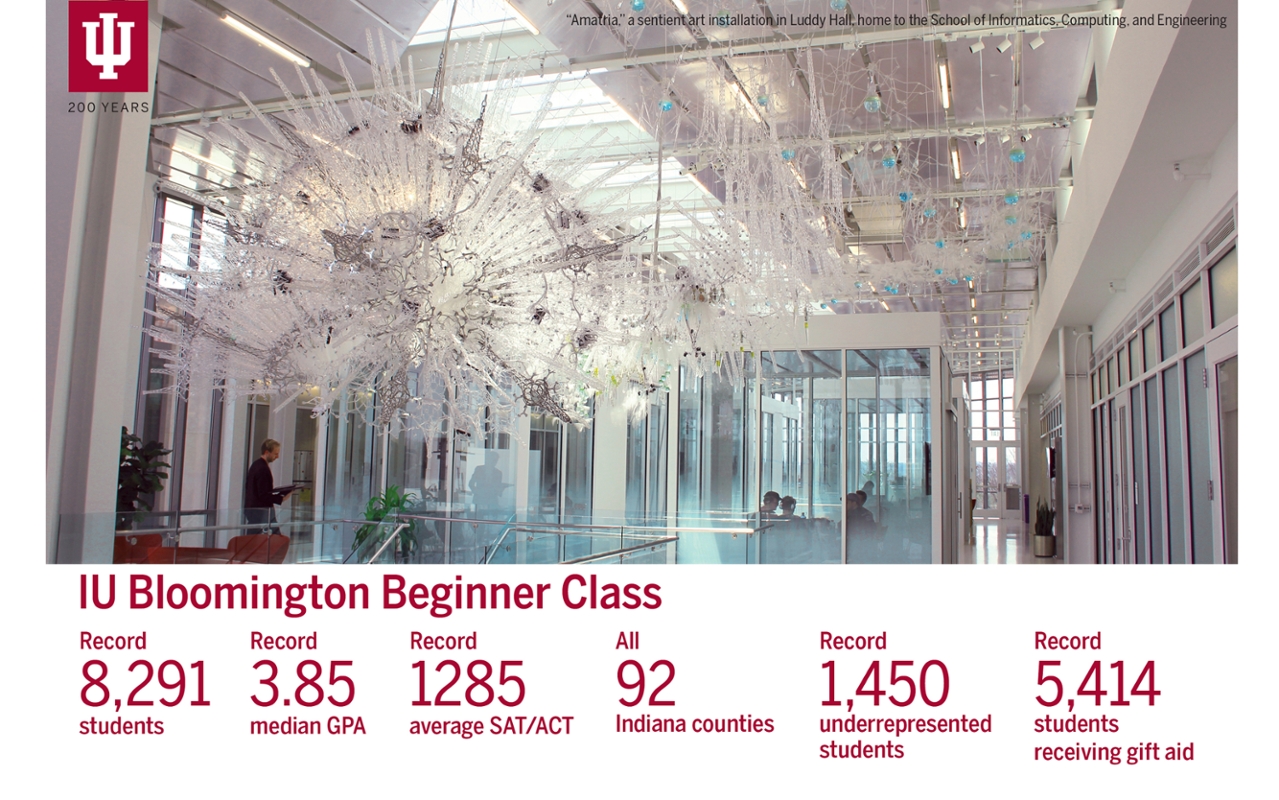
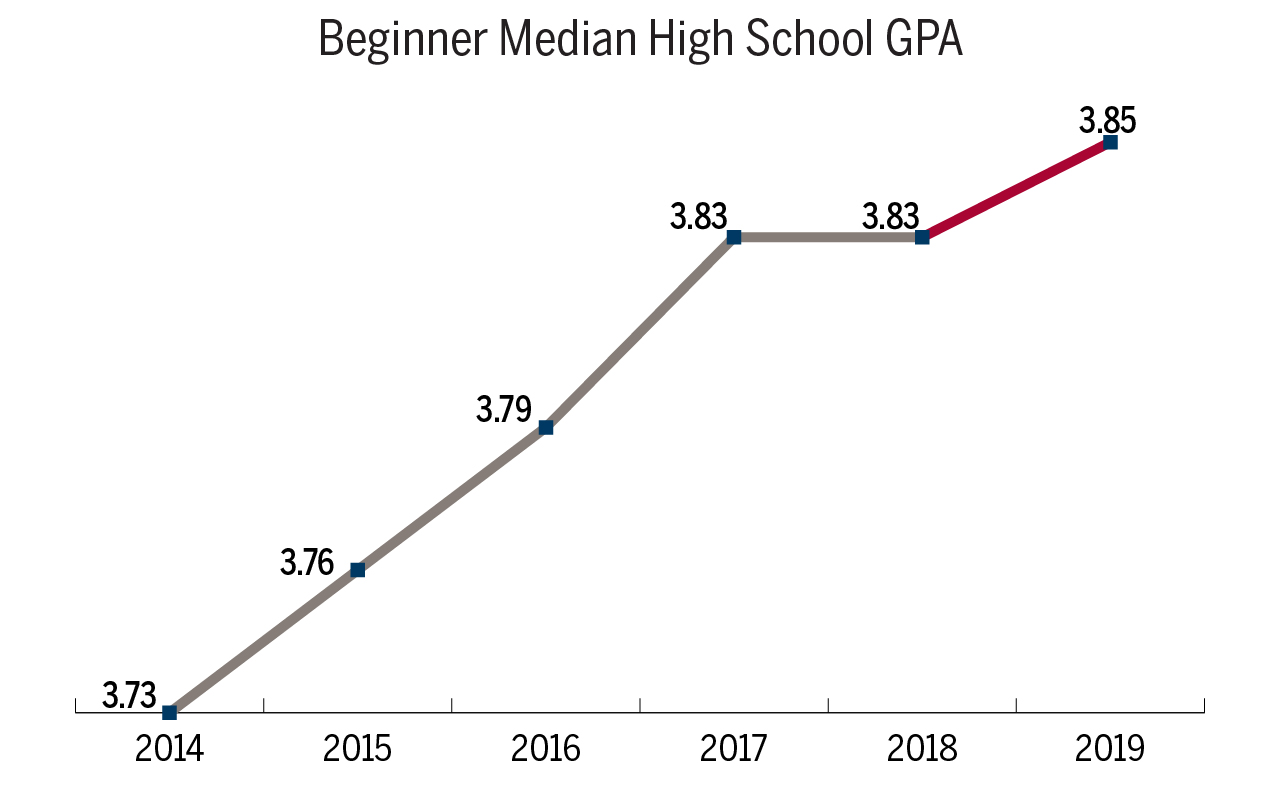
Beginner Median High School GPA graph shows a GPA of 3.73 in 2014, 3.76 in 2015, 3.79 in 2016, 3.83 in 2017, 3.83 in 2018, and 3.85 in 2019.
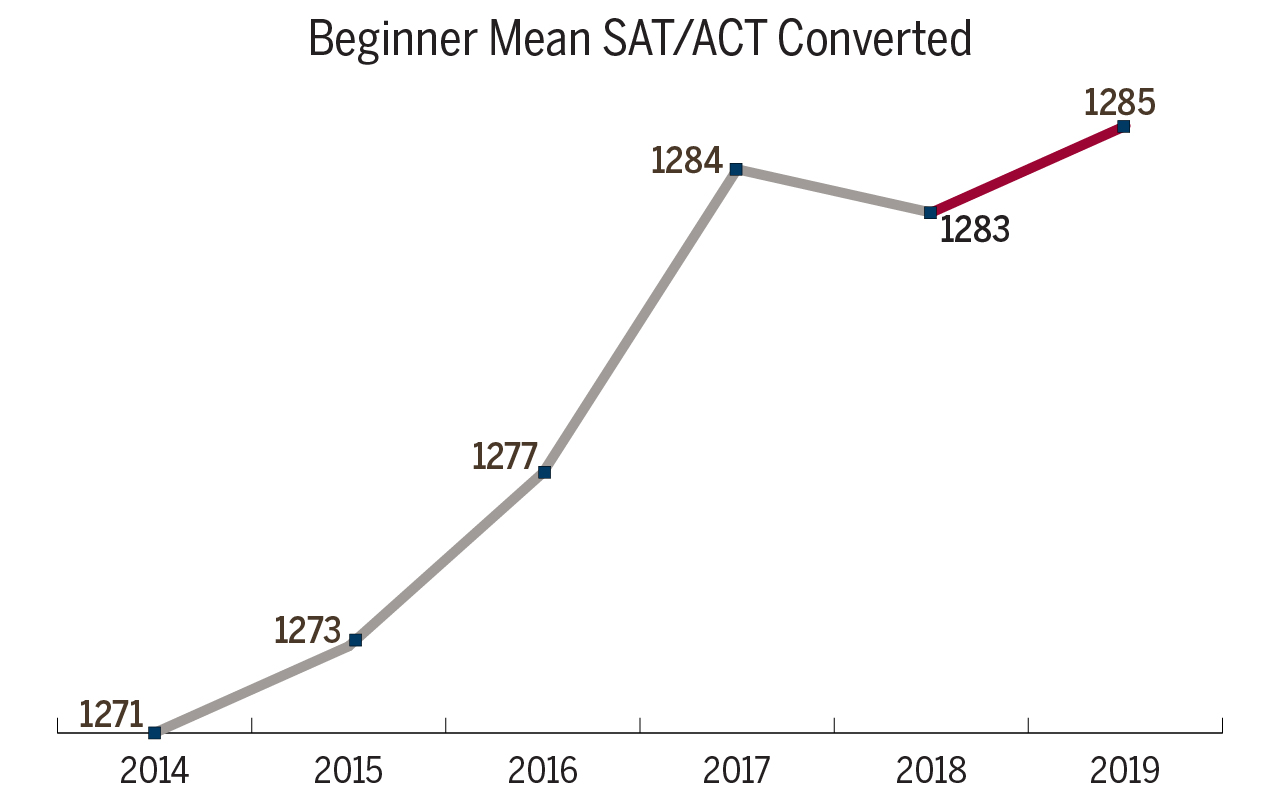
Beginner Mean SAT/ACT Converted graph shows a score of 1271 in 2014, 1273 in 2015, 1277 in 2016, 1284 in 2017, 1283 in 2018, and 1285 in 2019.
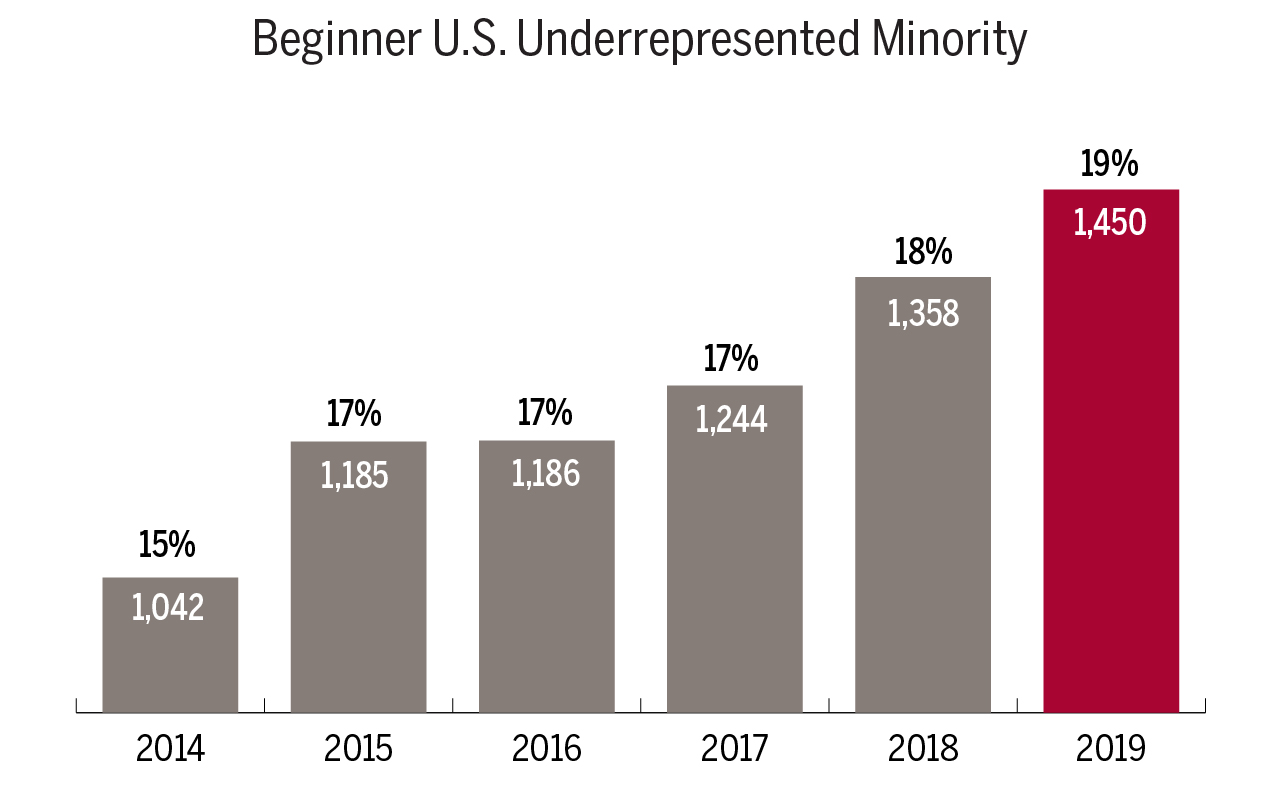
*Due to a university-wide data update after the fall 2019 census date, the underrepresented number for fall 2019 has been adjusted. All other years remain unchanged.
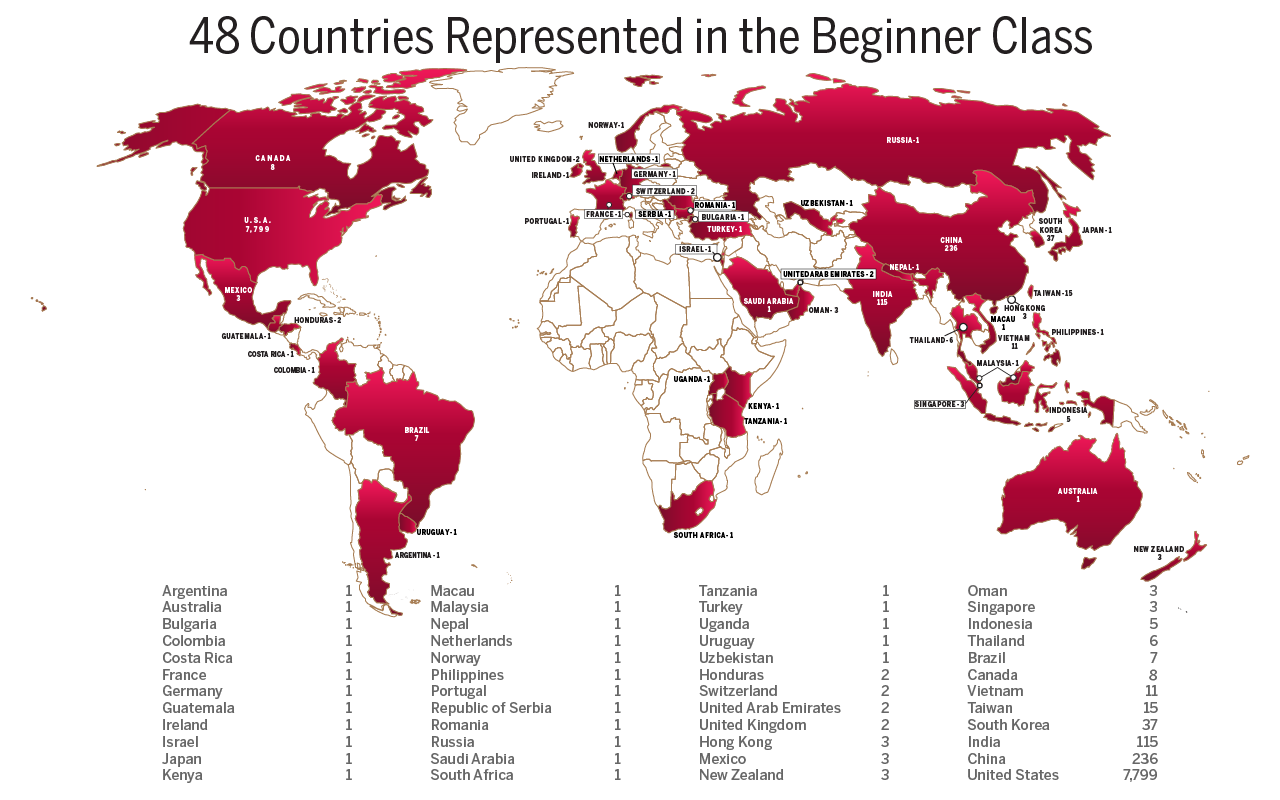
The 48 Countries Represented in the Beginner Class map shows 1 student from Argentina, 1 student from Australia, 1 student from Bulgaria, 1 student from Colombia, 1 student from Costa Rica, 1 student from France, 1 student from Germany, 1 student from Guatemala, 1 student from Ireland, 1 student from Israel, 1 student from Japan, 1 student from Kenya, 1 student from Macau, 1 student from Malaysia, 1 student from Nepal, 1 student from the Netherlands, 1 student from Norway, 1 student from the Philippines, 1 student from Portugal, 1 student from Romania, 1 student from Russia, 1 student from Saudi Arabia, 1 student from South Africa, 1 student from Tanzania, 1 student from Turkey, 1 student from Uganda, 1 student from Uruguay, 1 student from Uzbekistan, 2 students from Honduras, 2 students from Switzerland, 2 students from the United Arab Emirates, 2 students from the United Kingdom, 7,799 students from the United States, 3 students from Hong Kong, 3 students from Mexico, 3 students from New Zealand, 3 students from Oman, 3 students from Singapore, 5 students from Indonesia, 6 students from Thailand, 7 students from Brazil, 8 students from Canada, 11 students from Vietnam, 15 students from Taiwan, 37 students from South Korea, 115 students from India, and 236 students from China.
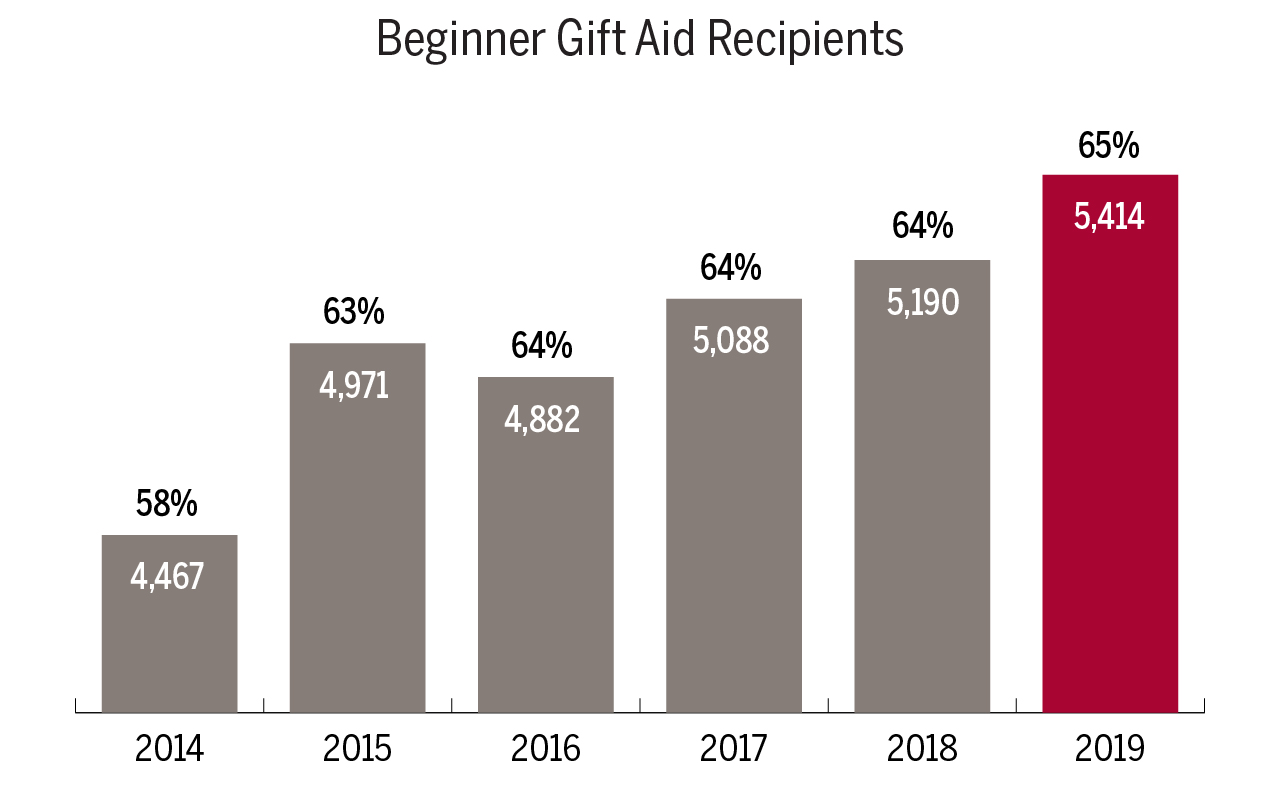
Beginner Gift Aid Recipients graph shows 58% or 4,467 students in 2014, 63% or 4,971 students in 2015, 64% or 4,882 students in 2016, 64% or 5,088 students in 2017, 64% or 5,190 students in 2018, and 65% or 5,414 students in 2019.
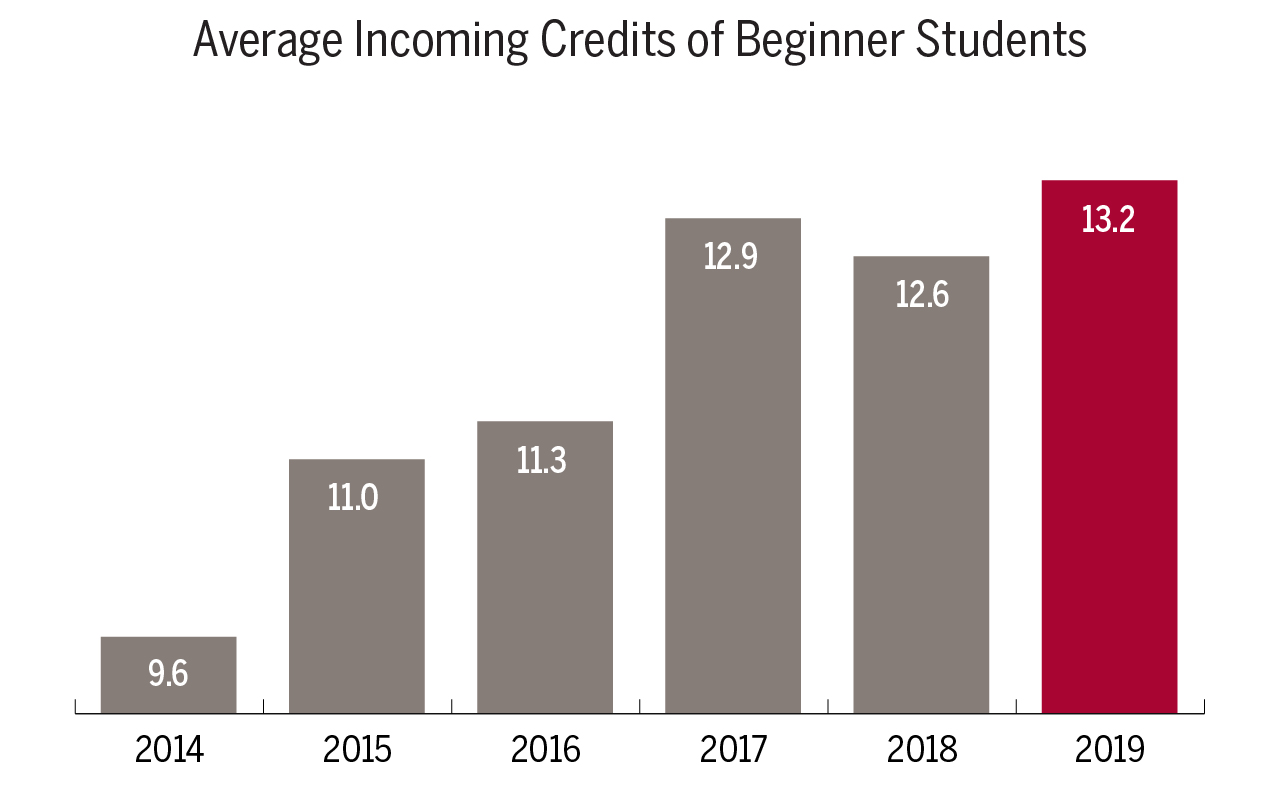
Average Incoming Credits of Beginner Students graph shows an average of 9.6 credits in 2014, 11 credits in 2015, 11.3 credits in 2016, 12.9 credits in 2017, 12.6 credits in 2018, and 13.2 credits in 2019.
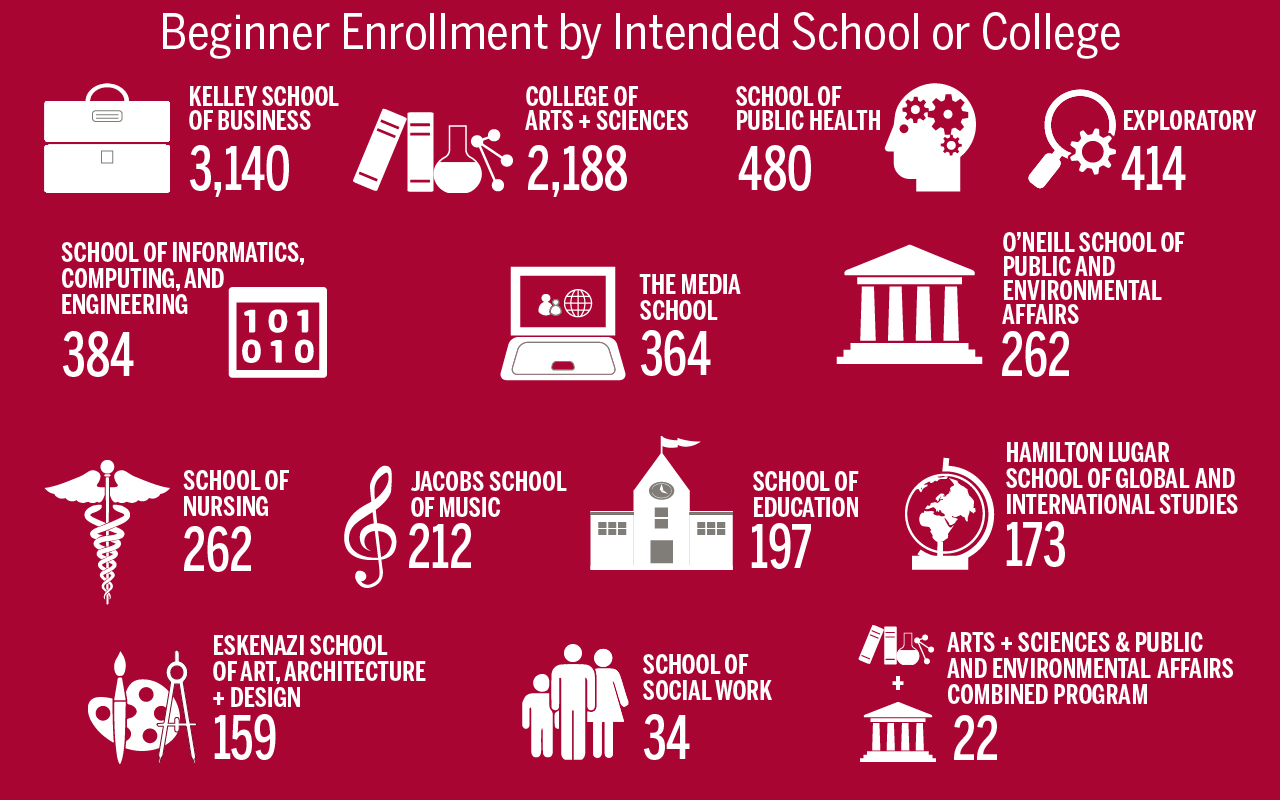
Beginner Enrollment by Intended School or College graphic show 3,140 students at the Kelley School of Business, 2,188 students at the College of Arts + Sciences, 480 students at the School of Public Health, 414 students enrolled as Exploratory, 384 students at the School of Informatics, Computing, and Engineering, 364 students at The Media School, 262 students at the O’Neill School of Public and Environmental Affairs, 262 students at the School of Nursing, 212 students at the Jacobs School of Music, 197 students at the School of Education, 173 students at the Hamilton Lugar School of Global and International Studies, 159 students at the Eskenazi School of Art, Architecture, + Design, 34 at the School of Social Work, and 22 at the Arts + Sciences & Public And Environmental Affairs Combined Program.

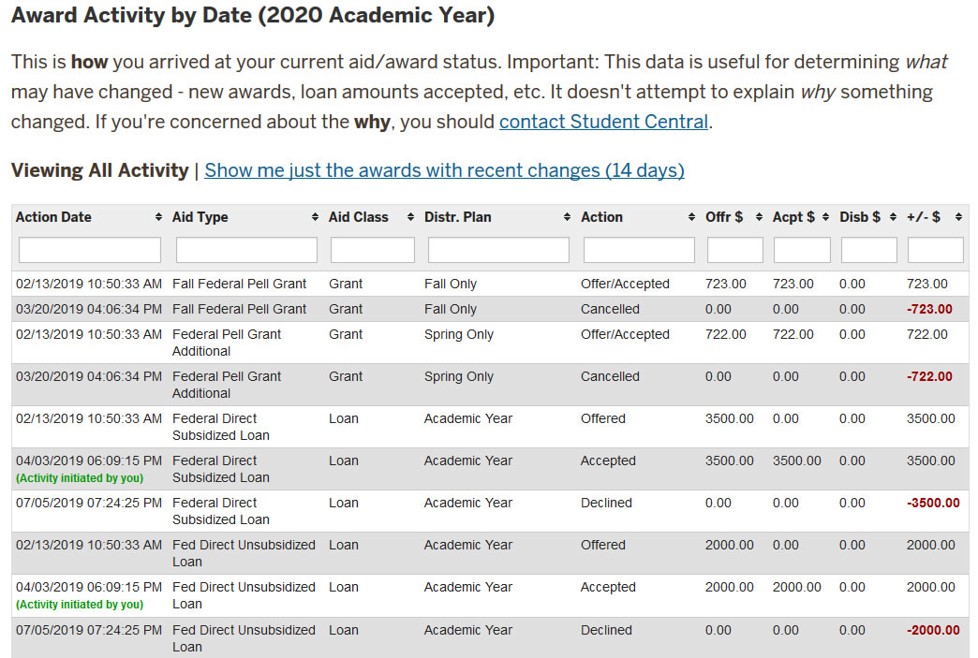
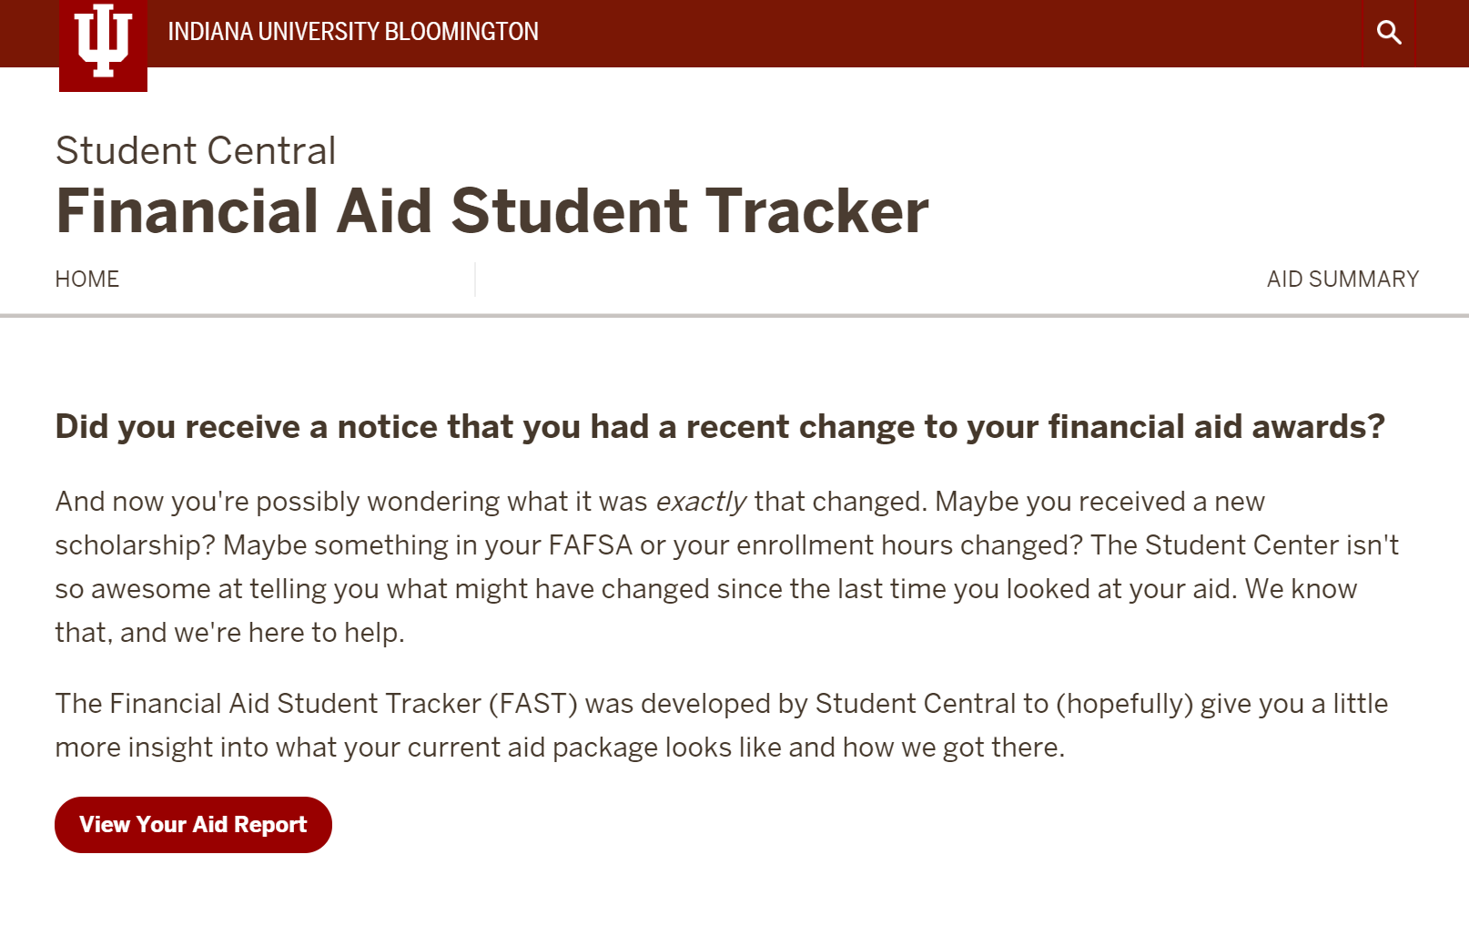
Student Central created the Financial Aid Student Tracker (FAST) report to help students understand changes to their financial aid awards. Previously, students received an electronic financial aid notification (eFAN) when their aid packages changed due to scholarship, grant, or loan updates. The eFAN allows them to see the updated aid package but does not detail the changes. Now students can use the FAST tool to see and understand all aid activity.

The Indiana County Bicentennial Scholarship continues to make IU possible for students from the 25 lowest-enrolling counties in the state. The $10,000 scholarship ($2,500 annually), along with expanded community outreach, has resulted in significant growth in enrollment from these counties. Since 2016, 411 students have received a total of nearly $2 million through this program, and enrollment from these counties has increased 11 percent. This year’s beginner class includes a record 141 Bicentennial Scholars.

Not only does the IU 21st Century Scholars Program offer you financial aid, but they offer you a support system when you need it.

Eunice Wu, class of 2021
Major: Finance
Minor: Law and Public Policy

At eight years old and with no knowledge of English, Eunice Wu moved to Indianapolis from Hunan, China. Ten years later, she was valedictorian of her high school class.

Clearly a talented and hardworking student, she knew she was destined for college. But when her stepfather passed away during her senior year, her family’s financial future was uncertain—and her college application process was one of many responsibilities on her plate.

Thanks to the 21st Century Scholarship and IU’s 21st Century Scholarship Covenant, Eunice was able to focus on school and family without worrying about college finances.

Now more than ever, students with OEM scholarships receive benefits far beyond financial support. This year, the Office of Scholarships expanded their current scholar programming to provide these students—Hoosier Scholars—with more events and opportunities to enrich their academic experience. Scholars enjoyed events, including dinners, study breaks, sporting events, and community service days. By celebrating and supporting students through these engagement opportunities, we are fostering a community of scholars.

This year, we fully rolled out pre-registration. For the third consecutive year, almost the entire incoming beginner class registered for fall semester courses during New Student Orientation. Since 2015, first-time student drops have decreased by about 3 percent, and students have adjusted their schedules about 17 percent less than in previous years.

We are grateful for the support of our many partners on and off campus. We look forward to continuing to create and streamline pathways for students to enroll, connect, and thrive at IU Bloomington.

Learn more about the goals and accomplishments of the Office of Enrollment Management